SG Options Trading Journal
What went wrong with today’s trade
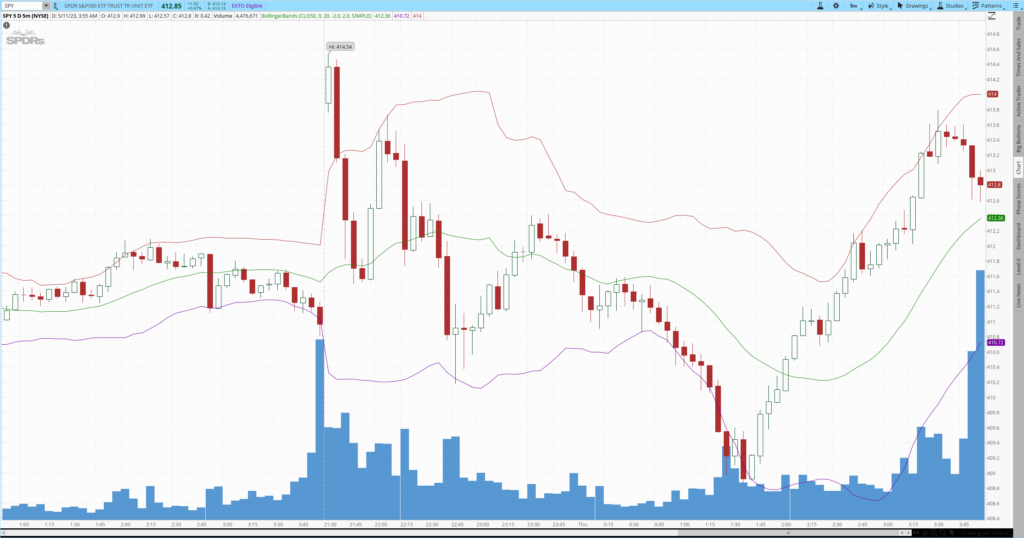
Last night SPY trading range was $410.25 to $412.19. That’s within the trade parameters of $408 to $413.
Which could well net in a total profit of (300 + 800)=$800!
However, the loss was $930!!!
What went wrong?
1. Position size was too big
The same problem – too greedy. The position is big at 50, for a profit of $300.
Can the trade size be smaller and net in a decent profit? The answer is yes, we could have made $200 without such a huge exposure.
Lesson: Choose the smallest possible size to trade.
2. Taking risky positions
The strike are too close to the money. In other words, could I have chosen a strike that is further away and yet make a decent profit?
The answer is yes, I could have chosen a strike further away and make $200 with a decent profit.
Then I will have less risk exposure.
By aiming for quick profits, my delta is high and potential loss and gain is highly sensitive.
Lesson: Choose the farthest strike price I can trade.
3. Following the trend
On the first sign of market up trend, I put in the spread of 408/409. As the trend weakens, the 408 strike became closer to the money. Recall that this is a bull spread, so being close to the money will get priced out quickly.
When it became weak and begun reverval, I quickly sold it.
Lesson: selling too quickly on a market reaction, even when the low of 410 is out of range ($409).
Now, after selling the spread, I quickly entered into a bullish position and follow the trend from 411.19.
Of course, the trend didn’t last and began ranging at 411.75 to 412. This cause paper loss of $200 to $350.
If I had hold my guns and waited for the market to stabilize, I would have found a better price to enter the position.
Lesson: Do not follow the trend.
All in all, sound risk management has been practiced to prevent further losses.
Be patient and disciplined, and you will be rewarded.
What went wrong with today’s trade
Today morning looks like the perfect setup:
Between 11.30am to 1.30am, market was falling in a sure manner. It could have been $350 of profits, $450 max.
However, the day ended up with a total loss of $278.
Not too bad, but what can be done better?
Here’s a recap of what went wrong:
1. Too greedy
The same old problem. Traded 100 bear puts at $413-$414 at $0.03, Why at $413?
- It was 1 standard deviation away.
- The potential profit looks high.
- Itching for a trade?
took some profit at 30x $0.02. The remainder 70 was open for the night, hoping to expire worthless. for a profit of $300?
Lesson learnt: Trade in smaller quantities. Take profit early.
2. Too much risk
Leaving positions open for the night is risk! Hoping the market not to touch strike price – not a fat chance!
Always be monitoring open positions.
Lesson learnt: Always manage risk, first. Ensure stop loss is in place.
3. Underestimating the market
The last 2 hours the market suddenly became bullish, making a move of $4 within the last 2 hours.
Previous day patterns showed the market to be sleeping.
Lesson learnt: Never underestimate what the market may do in the last few hours!
The Collar Spread
The collar trade is designed to be a long-term trade, usually more than 12 months expiration.
Long-term calls have more time value compared to long-term puts. The more distant the expiration date, the larger is this different.
Here’s an example of a collar spread:
- Buy 100 shares of ZZZ at $19 per shared.
- Buy 1 Jan 2021 20 Put @ $2.90
- Sell 1 Jan 2021 25 Call @ $1
The net cost is (2.90 – 1.000) x 100 + 190 x 100 = $2090.
If the stock price falls below $20, the stock will be called away at $20. The call will expire worthless.
If the stock price goes above $25, the stock will be called away at $25. The put will expire worthless.
The maximum potential loss on a collar trade can be reduced by moving the strike prices closer together, but this also reduces the maximum potential proceed. The strike price of the short call must always exceed that of the long put in order for a profit to be possible.
To achieve the maximum return, it is generally required to stay in the trade until expiration.
Standard collar trades on highly volatile stocks are generally not appealing. Collar trades are for more conservative stocks.
The higher volatility usually results in a greater net cost fot the options. This will increase the maximum possible loss on the trade.
Advanced collar trade
The standard collar trade can be modified to give better payoffs.
Use a call option instead of holding the stock
Since an in-the-money call option price with a high delta moves almost together with the stock price, consider buying the call instead of owning the stock.
Sell fewer calls for unlimited profit potenail
If 400 shares are bought, consider selling 3 calls on the collar trade. This will will free up 100 shares for unlimited upside profit.
Sell another further out-of-the-money put for extra money
For example, sell another 1 out-of-the-money 17.50 Put for extra money. In case the stock price starts falling, the puts will cancel out each other. It may be necessary to put on a stop loss order on the stock.
The Stock Enhancement Strategy
Like the stock repair strategy, the stock enhancement strategy can be used to significantly enhance the return on a stock investment with no additional cost.
Example 1
In early March, you buy 100 shares of ZZZ at the current price of $58. Target price is $75.
We’re looking at a profit target of (75 – 58) / 58 = 29 percent.
To enhance this strategy:
- Buy 1 Jan 70 call @ $3.70 per share
- Sell 2 Jan 75 calls @ $2.50 per share
This will produce a net credit of (2.50 x 2) – 3.70 = $1.30 per share.
The net holding is:
- A covered call (long 100 shares + short 1 Jan 75 call)
- A bull call spread (long 1 Jan 70 call + short 1 Jan 75 call)
If ZZZ is above $75 in 10 months at the January expiration:
- The stock will be called away for $75, with a (75 – 58) = $17 gain
- The bull call spread will be worth $5 per share
The total gain will be (17 + 5 + 1.30) = $23.30. This is equivalent to the stock price of (58 + 23.30) = $81.30, which is a profit of (81.30 – 58)/58 = 40 percent, compared to the gain in stock price movement of 29 percent.
Example 2
Instead of buying the stock, buy the call. Also buy the bull spread.
Suppose you buy the 1 Jan 40 call for $19.70 per share with a delta of 0.87. You also buy the bull spread with a credit of $1.30 per share.
This call price will likely advance dollar for dollar with the stock price.
The payoff at expiration if the stock price is above $75 will be (75 – 40) – 19.70 + 5 + 1.3 = $21.60 per share.
The P&L from -$19.70 to $21.60 represents a return of 110 percent!
3 Mistakes from Today’s Trade
3 May 2023 should been a profitable trade.

SPY dropped from 415 to 408, a whopping $7 change.
SPY bear put credit spread at strikes 419/420 should have netted $300.
QQQ bear put credit spread at strikes 326/327 should have netted $300.
That should have been a total of $600 credits.
However, the day ended with a loss of $50 and $100 respectively, a total of $150!
What went wrong?
The 3 mistakes
1. Know knowing a Fed rate decision is coming up.
The market moved wildly because of this decision coming up. Not knowning when is a big mistake. The markets should be avoided to not be in the whipsaw.
Leasson learned: monitor the calendar often.
2. Too greedy
The day itself saw immediate gain of $200. Forgoing this $200 in the hope of $100 for an extra day is a big risk!
Lesson learned: take profit as early as possible to reduce risk.
3. Stop loss is too tight
Stop losses were put in place on the last day and was hit by the wild swings.
Since the upside is $300, the protective stop should be -$300.
Having the protective stop of -$50 or -$100 is too easily hit and getting out of the game.
As planned carefully, the strike prices should never been hit and should expire worthless.
Lesson learned: On 0 DTE let it expire worthless as planned. Put protective stops further away.
Good things learned
This is the first time using protective stops, and it worked! Well, that costs $150.
The Stock Repair Strategy
Suppose we bought a good stock only to see it undergo a significant pullback in price. We still like the stock and feel that it will recover at least some of the ground that it lost.
There is a low-cost option strategy that can help you get back to a break-even status when the stock suddenly regains only part of its value.
The same strategy can also be used to greatly hance your profit in a stock for essentially no additional expense beyond the original cost of the stock.
This strategy is called the Stock Repair Strategy. The great appeal is that it involves no additional risk since it can be applied for little or no additional expense.
The Prerequisites
For this strategy to work, it is necessary for your fallen stock to make at least a partial recovery. If the stock price remains unchanged or continues to fall, this strategy offers no help.
The Plan
Buy 1 at-the-money call for each 100 shares of stock that you own.
Sell 2 out-of-the-money calls with the same expiration date to fund the purchase of your call.
Choose an expiration month for the options that is far enough out in time for the price of your stock to recover back to the strike price of the short calls.
This will produce a strategy of a covered call (long 100 shares + 1 short Jun 30 call) and a bull call spread (long 1 Jun 25 call + short 1 Jun 30 call).
How It Works
By buying a ratio spread of 1:2 of call options, you are bullish on the stock up till the expiration date.
Example 1
Suppose you bought 100 shares in December when it was $35. Initial the price went up, but in early March it slid to $23. You still like the stock and feel there is some hope for a recovery, though getting back to break-even at $35 seems far away.
With the stock repair strategy, you can buy 1 Jun 25 call for $3.30 per share and sell 2 Jun 30 calls for $1.75.
This nets you a credit of ($1.75 x 2 – 3.30)=$0.20.
Payoff
If the share is above $30 at the Jun options expiration, the stock will be called away at $30 per share. That’s a $7 per share gain over it’s present price of $23. The bull call spread will be worth $5 per share. The total gain will be (7 + 5 + 0.20)=$12.20 per share, equivalent to a stock price of (23 + 12.20)=$35.20.
Thus you will have reached slightly better than break-even, although the stock is still as much as $5 below your original purchase price.
Example 2
Suppose you bought 100 shares in Dec when it was $19.50. In early March the stock is down 15 percent to $16.50. If the stock can recover just 6 percent from its current level within 10 weeks, the stock repair strategy can help.
You can buy 1 May 15 call for $2.40 per share and sell 2 May 17.50 for $1.10 per share.
This requires you to pay ($1.10 x 2 – $2.40) = $0.20 up front.
Payoff
It costs $0.20 per share to hold a covered call + bull call spread.
If the stock is up 6 percent from its current value to $17.50 at the May options expiration, you will be slightly better than break-even. The stock will be called away at $17.50 per share for a $1 per share gain over its present price of $16.50. The bull call spread will be worth $2.50 per share.
Since the extra cost of the strategy is $0.20 per share, the net gain is (1.00 + 2.5 – 0.20) = $3.30, which is equivalent to a stock price of (16.50 + 3.30) = $19.80.
This is slightly better than break-even with the stock covering less than half of its loss.
Comment
In the second example, an upfront debit is required due to the shorter time expiration.
The first example was done for a small credit.
The longer the expiration, the more likely a credit will be generated.
Conditions of a straddle trade
Here are some guidelines to identify key criteria to a successful straddle trade:
1. Stock price must move within the target time frame
The stock price will need to move up or down sufficiently to offset the loss of time value in the call and put that form the straddle.
Remember, theta is the main enemy of a successful straddle trade.
A good way to achieve a profit within an acceptable time frame is to use an options calculator to determine the necessary price movement needed.
2. Identify upcoming events
Identify an upcoming event that could significantly impact the price of the stock.
The event needs to be such that good news will lead to a rise in stock price, and vice versa for bad news.
Examples are earning announcements, court decisions and FDA rulings.
3. Have ample expiration date
The expiration date should be sufficient to allow the upcoming event to occur and produce the necessary price movement.
4. The upcoming event must not generate interest yet
The upcoming event must not generate enough excitement to cause the options price to be overly infalted.
These can be judged in several ways:
- Level of open interest
- Trading volume of the options
- Current implied IV of the options against historical averages.
5. Look for a stock that has been trading sideways within a narrow price range
This signifies an even battle between buyers and sellers of the stock.
When the price breakouts, either up or down, option prices will gain extra time value and produce an increased potential profit in the straddle.
When you’re in a straddle trade, here are some guidelines to exit the trade:
1. Sometimes it is better to exit one side of the trade first
There are times where it will be best to exit one side of the straddle trade before the expected event occurs.
An earnings run is one example. The stock price may move up sharply just prior to the scheduled earnings announcement. In this case, it may be wise to take profit on the call leg first and hold the put until after the earnings announcement.
If the stock price falls after the earnings announcement, the exit price for the put will be better.
2. Do not stay in the straddle too long
After the event has taken place, do not stay in the straddle too long.
If the event causes a significant move in the stock price, it may pump extra time value into the price of the profitable option temporarily. Sell this option before the extra time value shrinks.
3. Nover hold both sides of the trade until expiration
If nothing happened to create a price move, the straddle will lose a substantial portion of it value during the last 3-4 weeks of its life.
As such, exit early when there is at least 3-4 weeks before the options expire to cover early.
It is recommended that straddle options have at least 30 days of expiry time left after the expected event to capture as much value of possible.
Otherwise, holding options near expiration generally lead to a losss on the trade.
Diagonal Calendar Spreads
The diagonal calendar spread uses a different strike price in the near-term option than in a longer-term option. This can be a credit spread or a debit spread.
For a diagonal credit spread:
- the strike price of the long option is out-of-the-money.
- the strike price of the short option is at-the-oney.
The credit diagonal spread frequently works best then the 2 strike prices are no more than $2.50 apart, because it keeps the maxium risk on the trade at a reasonable level.
Replicating the diagonal calendar spread
The credit diagonal spread can also be viewed as:
- a regular calendar spread
- a front-month credit spread (vertical spread)
A vertical spread provides a credit that finances the cost of the calendar spread.
An example:
- Buy 1 Oct 126 call
- Sell 1 Sep 126 call
- Buy 1 Sep 126 call
- Sell 1 Sep 124 call
When the credit diagonal spread is created with calls, the attitude is that the price of the underlying will move either sidewaysor downward.
When the credit diagonal spread is created with puts, the profit zone caters to a sideways or upward movement.
Debit diagonal spreads
This basic idea for a debig diagonal spread is:
- The strike price of the short option is out-of-the-money.
- The strike price of the long option is at-the-money.
This reduce the cost basis for the long option while allowing more some movement in the price of the underlying in a direction favourable to the long option.
–
Ratio Calendar Spread
A modification of the calendar spread, the ratio calendar spread trade have more contracts sold than bought.
With more long contracts, this removes the constraint on one end of the profitability range, thereby allowing for unlimited profit if the stock price makes a large move in the appropriate direction.
Fewer near month contracts are sold than the number purchased of distant month contracts.
With call, this has the effect of opening the upper end of the risk graph for unlimited profit if the stock moves higher.
With puts, this has the effect of opening the lower end of the risk graph for unlimited profit if the stock price moves lower.

Ratios such as 3:2 or 4:3 are good ones to consider.
Volatility Skews for Calendar Spreads
Typically, volatility skews for calendar spreads between 10% and 25% work best.
Be suspicious of volatility skews between 30% or greater, particularly when both options have unusually high IVs.
An unusually high volatility skew often means that the front-month options are being used for wild speculation in the underlying stock due to some impending event that could dramatically alter the stock price.
If the IV skew is 50% or greater, the danger here for a calendar spread is twofold:
- It may instantaneously move the stock price out of the profitability range of the calendar spread.
- Even if the stock price remains unchanged, all the volatility will quickly collapse back to more normal levels after the event has passed. This is called a volatility crush.
A volatility crush can crush the price of the long option to a fraction of its original value, destroying the potential profit in the trade.
IV skew = (IV front-month – IV back-month) / IV back-month